Blockage of CMA displays a senescence-like phenotype
To assess CMA activity during senescence in aging cells, we isolated mouse ear fibroblasts (mEFs), a reliable primary cell model for the study of aging in vitro39,40, as, at early passages, they allow analyzing aging separately from replicative senescence. We confirmed, as reported previously39, that mEFs from aged mice (23-month-old; 23 m) were not more senescent than those from young mice (4-month-old; 4 m) using senescence-associated β-galactosidase (SA-β-gal) staining or p16INK4A messenger RNA, but could still be induced into senescence 7 days after initial treatment with palbociclib (Palbo) (Extended Data Fig. 1a,b). ProteoSTAT staining confirmed the characteristic loss of proteostasis and increased protein aggregation in aged mEFs (Extended Data Fig. 1c), which could be directly attributed to the CMA decline with age29, as we found comparable protein aggregation in mEFs from 4 m CMA-deficient (L2AKO) mice32 (Extended Data Fig. 1c). To monitor CMA activity upon senescence induction, we used mEFs from transgenic KFERQDendra mice, which systemically express a fluorescent CMA reporter41,42 consisting of the CMA-targeting motif KFERQ fused to Dendra2. KFERQDendra is recognized by Hsc70 and delivered to LAMP2A, generating fluorescent lysosomal puncta42. Following LAMP2A binding and unfolding, KFERQDendra is translocated for degradation in the lysosomal lumen42. The number of fluorescent Dendra+ puncta is a validated measure of CMA41 as this motif is necessary and sufficient for CMA but necessary yet not sufficient for endosomal microautophagy (e-MI)43,44. This reporter mouse model has been extensively used to analyze CMA changes during aging29 and age-related diseases32,45,46,47. Using primary mEFs from KFERQDendra mice (Fig. 1a), we found that CMA activity was upregulated 7 days after Palbo treatment in 4 m fibroblasts, as previously described in mouse fibroblast lines34 (Fig. 1b); however, cells from 23 m mice displayed lower basal CMA activity and failed to upregulate CMA in response to the senescence stimulus (Fig. 1b). Reduced Dendra-positive puncta in 23 m mEFs were not due to decreased Dendra expression (Extended Data Fig. 1d). Instead, 23 m mEFs exhibited significantly lower Dendra lysosomal degradation, which, unlike in 4 m mEFs, remained unchanged upon senescence induction, supporting impaired delivery and internalization into lysosomes via CMA (Extended Data Fig. 1e).

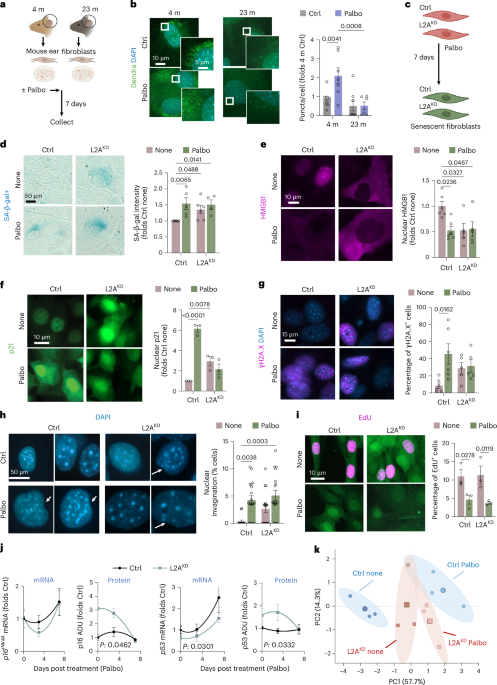
a, Schematic of senescence induction with Palbo in ear fibroblasts isolated from mice of different ages. Scheme created in BioRender; Sereda, R. (2026) b, Representative immunofluorescence images (left) and quantification (right) of KFERQ-Dendra+ puncta in ear fibroblasts from 4 m- and 23 m-old mice control (Ctrl) or senescent (Palbo). Nuclei are highlighted with 4,6-diamidino-2-phenylindole (DAPI). Insets show higher magnification of the boxed areas. n = 6 independent experiments with fibroblasts from six different mice. c, Schematic of senescence induction with the indicated stimuli in NIH3T3 mouse fibroblasts control (Ctrl) or knockdown for L2A (L2AKD). Scheme created in BioRender; Sereda, R. (2026) d–h, Staining for SA-βgal (d), HMGB1 (e), p21 (f), gH2A.X (g) and DAPI (h) in Ctrl and L2AKD cells untreated (none) or 7 days after senescence induction with Palbo. Representative images (left) and quantification (right) with values expressed relative to Ctrl untreated. Arrows in h indicate nuclear indentations. n (left to right) = 5, 5, 6, 4 (d), 6, 6, 5, 5 (e), 3 (f), 6, 6, 5, 5 (g) and 6 (h) independent experiments. i, Representative images and quantification of EdU+ NIH3T3 mouse fibroblasts control (Ctrl) or knockdown for L2A (L2AKD) 7 days after single treatment with Palbo. n = 3 independent experiments. j, Quantification of p16INK4A, p21 and p53 mRNA levels by qPCR in Ctrl or L2AKD cells at the indicated times after a single exposure to Palbo. n = 6 independent experiments. k, PCA of 12 variables measured in Ctrl and L2AKD cells induced or not into senescence with Palbo. Each dot represents an individual experiment. Ellipses are the 95% CI around the center of mass of a given experimental group. In all bar graphs, data represent mean ± s.e.m. of the individual values shown. Two-way analysis of variance (ANOVA) was used in b and d–j. All values were compared but only P values of statistically significant comparisons are shown.
Source data
To determine the consequences of reduced CMA during senescence, we stably knocked down Lamp2a, the CMA rate-limiting component22, in an untransformed fibroblast cell line (NIH3T3) (L2AKD) (Extended Data Fig. 1f,g and Supplementary Note 1) and induced senescence with Palbo (Fig. 1c). Even before senescence induction, L2AKD cells displayed SA-β-gal (Fig. 1d) and nuclear high mobility group box 1 protein (HMGB1) (Fig. 1e) levels comparable to senescent control cells, with no further increases after inducing senescence with Palbo (Fig. 1d,e). Before inducing senescence, L2AKD cells also showed partial increases in nuclear p21 (Fig. 1f), γ H2A.X (Fig. 1g), and nuclear invaginations (Fig. 1h), but retained normal proliferation and underwent proliferative arrest only after senescence induction (Fig. 1i), indicating that CMA loss alone does not induce a full conventional senescent phenotype.
Transcription of senescence-associated factors such as p16INK4A, p21 and p53, revealed no basal differences between control and L2AKD cells and comparable kinetics upon induction of senescence with Palbo (Fig. 1j and Extended Data Fig. 1h). Notably, L2AKD cells displayed selective differences in basal and senescence-induced changes in protein levels of p16 and p53, but not p21 (Fig. 1j and Extended Data Fig. 1h,i). A similar discrepancy between transcript and protein levels of p16, and p53, but not p21, was also observed upon induction of senescence with other stimuli (etoposide, paraquat and the telomerase inhibitor BIBR1532) (Extended Data Fig. 1j,k).
These findings suggest that while CMA-deficient cells display some senescence-related features, they are different from senescent cells. Principal-component analysis (PCA) using the readouts in Fig. 1 and Extended Data Fig. 1 shows that L2AKD cells cluster between control and senescent control cells, thus confirming that loss of CMA is not enough to drive cells into conventional senescence (Fig. 1k). Following senescence induction, control and L2AKD senescent cells also separate distinctly (Fig. 1k), indicating that CMA is dispensable for senescence establishment, but its loss alters the senescence response and resulting senescent properties.
CMA loss phenocopies the proteome changes of aged senescent cells
The discrepancy between transcriptional changes and protein levels of senescence markers in L2AKD cells, together with the contribution of CMA to proteome remodeling in other cellular conditions25,28,48,49, prompted us to perform comparative proteomics of mEFs from young control (4 m Ctrl), young CMA-deficient (4 m L2AKO) and aged control (23 m Ctrl) mice induced or not into senescence with Palbo.
Blockage of CMA in young cells reproduced almost half of the changes identified in the basal proteome of aged cells (Fig. 2a and Extended Data Fig. 2a). Pathway analysis of these shared changes showed enrichment in proteins involved in lipid metabolism, oxidative phosphorylation, protein translation, vesicular trafficking and extracellular matrix (ECM) remodeling (Fig. 2b). When considering only proteins with increased levels (potentially due to defective degradation), we found additional enrichment in senescence-related pathways such as wound healing and immune processes (Extended Data Figs. 2b,c).

a,b, Quantitative analysis of the basal proteomes of ear fibroblasts from 4 m Ctrl, 4 m L2AKO and 23 m Ctrl mice. Heatmap and hierarchical clustering analysis of full proteomes (a) and Gene Ontology (GO) terms of the pathway enrichment analysis in the group of proteins changing (increasing or decreasing) in 23 m Ctrl mice relative to 4 m Ctrl, which were phenocopied by 4 m L2AKO (b). Numbers in b indicate number of proteins in each group. c,d, Quantitative analysis of the effect of Palbo on the proteomes of ear fibroblasts from 4 m Ctrl, 4 m L2AKO and 23 m Ctrl mice. Heatmap and hierarchical clustering analysis (c) of Palbo-induced changes and GO terms (d) of the pathway enrichment analysis in the group of proteins that fail to decrease upon Palbo addition in 23 m Ctrl and in 4 m L2AKO fibroblasts. Numbers in d indicate number of proteins in each group. e–g, Quantitative analysis of the proteome undergoing lysosomal degradation in 4 m and 23 m Ctrl and 4 m L2AKO fibroblasts upon induction of senescence with Palbo. Heatmap and hierarchical clustering analysis of the effect of lysosomal degradation inhibitors (N/L) in untreated cells (none, n) or 7 days after induction of senescence with Palbo (p) (e). GO terms from the pathway enrichment analysis of proteins that are degraded by CMA in the presence of Palbo (f) and STRING depiction of pathway enrichment analysis of proteins that fail to be degraded upon senescence induction in 23 m Ctrl and 4 m L2AKO relative to 4 m Ctrl fibroblasts (g). h–j, Quantitative metabolomic analysis in ear fibroblasts from 4 m Ctrl, 4 m L2AKO and 23 m Ctrl aged mice induced into senescence with Palbo. Heatmap and hierarchical clustering (h) and pathway analysis with the metabolites detected in the three groups of cells upon Palbo administration (i). Pathways changing only in 4 m Ctrl (blue), only in 4 m L2AKO and 23 m Ctrl (red) or in the three groups (black) are labeled. Heatmap of metabolite enrichment analysis in the same groups of cells upon Palbo addition relative to control (j). n = 3 independent experiments for proteome from three different mice (a–g) and n = 6 for metabolome from six different mice (h–j). Fisher’s exact test based on the hypergeometric distribution was used in b, d and f and pathway impact score in i was calculated using relative betweenness centrality and out-degree centrality. All GO terms are statistically significant for P < 0.05.
Upon Palbo-induced senescence, 4 m L2AKO and 23 m Ctrl cells showed 45% concordance in their proteome remodeling, with close to 400 proteins displaying changes relative to 4 m Ctrl, and only 200 proteins differing between 4 m L2AKO and 23 m Ctrl, despite their age difference (Fig. 2c and Extended Data Fig. 2d). Proteins that decreased during senescence in 4 m Ctrl cells, but not in 4 m L2AKO and 23 m Ctrl cells, were involved in protein translation, immunoregulatory signaling, glucose metabolism, response to stress, actin cytoskeleton remodeling and vesicular trafficking (Fig. 2d and Extended Data Fig. 2e).
To identify which proteomic changes were due to failure to undergo degradation by CMA, we performed quantitative proteomics in the presence of inhibitors of lysosomal proteolysis (N/L) (Fig. 2e and Extended Data Fig. 3a). CMA substrates were identified as proteins undergoing lysosomal degradation in 4 m Ctrl cells (≥1.5-fold increase upon N/L addition) in a L2A-dependent manner (no changes in L2AKO cells upon N/L addition)50 (Extended Data Fig. 3a). Comparison between 4 m Ctrl and 23 m Ctrl cells identified 64 proteins no longer degraded in lysosomes in the aged group (Extended Data Fig. 3a), over half of which were CMA substrates (degraded in 4 m Ctrl but not L2AKO cells) (Extended Data Fig. 3b). These CMA substrates showed functional overlap (Extended Data Fig. 3c) with the group of proteins that accumulate in aged 23 m Ctrl cells, confirming that a fraction of the age-related proteomic changes are due to failure to undergo degradation via CMA.
Next, we inhibited lysosomal proteolysis in cells induced into senescence with Palbo to identify the senescence-induced CMA degradome (Fig. 2e and Extended Data Fig. 3d). Although 67 proteins underwent CMA degradation independently of senescence, 532 and 271 proteins were only degraded under basal or senescence conditions, respectively (Extended Data Fig. 3e). Senescence-induced CMA substrates were involved in protein translation, vesicular trafficking and metabolism (Fig. 2f and Extended Data Fig. 3f). Similar analysis in 23 m Ctrl fibroblasts induced into senescence (Extended Data Fig. 3d) revealed an age-associated decrease in the lysosomal degradation of most CMA substrates (Fig. 2e,g and Extended Data Fig. 4g,h).
These findings suggest that CMA loss contributes to the defective proteome remodeling of aged cells during senescence. By impairing degradation of proteins involved in metabolic regulation, vesicular trafficking and secretion, reduced CMA may drive metabolic dysregulation and an aberrant SASP in aged senescent cells.
CMA regulates senescence-induced metabolic changes
Given the enrichment of proteins involved in metabolism among the senescence-induced CMA substrates and the role of metabolic reprogramming in senescence and the SASP51,52, we investigated the impact of CMA loss on senescent cell metabolism. Metabolomics analysis of 4 m Ctrl, 4 m L2AKO and 23 m Ctrl primary mEFs revealed that, under basal conditions, CMA-deficient cells phenocopied many of the metabolic changes observed between young and aged cells (Extended Data Fig. 4a−c). These included energy production, carbohydrate and glycosylation pathways, lipid and membrane biosynthesis and amino acid and methylation pathways.
Upon senescence induction, the metabolic profile of 4 m Ctrl mEFs clustered separately from 4 m L2AKO and 23 m Ctrl mEFs (Fig. 2h). This was due to senescence-triggered changes missing in 4 m L2AKO and 23 m Ctrl cells (fatty acid β-oxidation), and others unique to these two groups but absent in 4 m Ctrl cells (tricarboxylic acid (TCA) cycle, aromatic amino acid and nucleotide metabolism) (Fig. 2i,j and Extended Data Fig. 4d). Pathways linked to mitochondrial function (taurine and hypotaurine metabolism), previously associated with senescence and aging53,54, changed in all groups but differed quantitatively in young cells (Fig. 2i,j). Analysis of individual metabolites supported similar basal and senescence-induced differences between 4 m L2AKO and 23 m Ctrl cells relative to 4 m Ctrl cells (Extended Data Fig. 4e−g and Supplementary Note 2).
Lastly, an integrative analysis combining proteomic and metabolomic datasets confirmed that proteins degraded by CMA during senescence in young cells, but not in aged cells, accounted for a substantial proportion of the observed metabolic differences, particularly the failure to engage in fatty acid and one-carbon metabolism (Extended Data Fig. 4h).
Collectively, these findings indicate that CMA loss recapitulates basal metabolic features of aged cells and contributes to their impaired metabolic reprogramming during senescence.
Deficient CMA alters senescence-associated secretory phenotype
The senescence-induced metabolic switch serves the biosynthetic demands required to sustain the SASP. Macroautophagy contributes to this energetic support34,55,56, but the role of CMA in regulating SASP abundance and composition remains largely unexplored. As many senescence-related proteome changes absent in 4 m L2AKO and 23 m Ctrl cells were associated with vesicular trafficking and secretion, we investigated the impact of CMA loss on the basal secretome and the SASP57.
Most SASP proteins are conventionally secreted through the endoplasmic reticulum (ER) and Golgi apparatus, but unconventional alternative secretory routes also contribute to SASP composition. These include translocation across the plasma membrane, exosome release from endosomes/multivesicular bodies58 and docking of autophagic and lysosomal compartments with the plasma membrane34. Using the ER-TurboID system59 for protein biotinylation within the ER in control and L2AKD fibroblasts (Extended Data Fig. 5a) we collected the medium 7 days after senescence induction with Palbo. Streptavidin pulled down conventionally secreted proteins (biotinylated), whereas unconventionally secreted proteins remained in the flow-through fraction (Fig. 3a).

a, Schematic of the procedure with ER-TurboID used to distinguish between conventional and unconventional secretion. Scheme created in BioRender; Sereda, R. (2026) b−e, Quantitative proteomic analysis of the conventionally (b,c) and unconventionally (d,e) secreted proteins by control (Ctrl) and L2A knockdown cells (L2AKD) under basal conditions. GO terms (b,d) and STRING depiction (c,e) of the pathway enrichment analysis of proteins found at higher (increase) or lower (decrease) abundance under basal conditions in L2AKD compared to Ctrl cells. Numbers in b and d indicate number of proteins in each group. f, Heatmap of the combined conventional and unconventional secretome of untreated L2AKD cells and Palbo-treated Ctrl cells (left). Heat maps on the right depict coinciding changes of conventional (top) or unconventional (bottom) secretion in L2AKD cells under basal conditions and in Palbo-treated Ctrl cells. g, STRING depiction of the pathway enrichment analysis of proteins only detected in the conventional (top) or unconventional (bottom) secretome of L2AKD cells induced into senescence. All the secretome analysis (a−g) was conducted in n = 3 independent experiments. h–l, Paracrine effect of the secretome from Ctrl and L2AKD senescent cells on Ctrl nonsenescent cells. Schematic of four-crossed secretome experiments. Scheme created in BioRender; Sereda, R. (2026) (h), representative SA-β-gal images (left) and quantification (right) (i), immunoblot for p21 (top) and quantification (bottom) (j), immunofluorescence for p21 (left) and quantification of nuclear staining (right) (k) and for HMGB1 (left) and quantification of nuclear staining (right) (l). n (left to right) = 4, 4, 5, 5 independent experiments (i); 5, 4, 4, 4 independent experiments (j); 94, 45, 42, 45 cells from three independent experiments (k); and 46, 55, 50, 47 cells from three independent experiments (l). Data in i−l represent mean ± s.e.m. and individual values. All GO terms are statistically significant for P < 0.05. Fisher’s exact test based on the hypergeometric distribution (b,d) and two-way ANOVA (i–l) were used. All values were compared but only P values of statistically significant comparisons are shown.
Source data
Source data
Comparative proteomics identified 161 conventionally secreted proteins (with confirmed signal peptide60) present across all conditions, but in different abundance (Extended Data Fig. 5b). CMA blockage under basal conditions increased extracellular levels of 71 proteins involved in ECM organization, cell migration, antigen presentation and wound healing and decreased secretion of 47 proteins related also to ECM, inflammation, adhesion, and lipid metabolism (Fig. 3b,c and Extended Data Fig. 5c).
More proteins were unconventionally secreted (340 proteins) although at lower abundance than conventionally secreted ones, and only 215 were shared across conditions (Extended Data Fig. 5d–f). L2AKD cells displayed reduced unconventional secretion of 130 proteins involved in vesicular trafficking and cell cycle regulation, and an unexpected increase in unconventional secretion of nuclear proteins not due to cell death or membrane rupture, as it was selective for certain nuclear proteins (those involved in chromosome organization, methylation, splicing and DNA repair), while other nuclear proteins (related to telomere extension and nucleolus organization) were reduced in abundance (Fig. 3d,e and Extended Data Fig. 5g).
We next investigated the effect of CMA deficiency on these secretomes upon senescence induction. Palbo-induced senescence in control cells increased conventional secretion of 37 proteins, but reduced secretion of 59, whereas 63 unconventionally secreted proteins increased and 89 decreased (Extended Data Fig. 5b,f). A large fraction of senescence-induced changes in the conventional and unconventional secretomes overlapped with the basal L2AKD cell secretome (Fig. 3f and Extended Data Fig. 5h–j) and was enriched in conventionally secreted proteins involved in collagen metabolism, cell adhesion and degranulation, and unconventionally secreted nuclear proteins, cytoskeletal and cell cycle regulators and protein folding proteins (Extended Data Fig. 5j,k).
Induction of senescence in CMA-deficient cells, rather than completing a full SASP, resulted in a markedly different secretory profile, as they failed to downregulate 39 conventionally secreted proteins but upregulated secretion of 47 additional ones involved in cell migration, ER protein folding and processing, extracellular protease regulators and several lysosomal enzymes (Fig. 3g and Extended Data Fig. 5b). Another large group of uniquely altered proteins was involved in immune responses, including macrophage activation, opsonization, antigen processing and presentation (Extended Data Fig. 5l). Although the unconventional secretome of senescent control and L2AKD cells shared some changes, more than two-thirds of the changes in L2AKD cells were unique, with a pronounced enrichment in immune-related proteins (Extended Data Figs. 5h,l). Comparison with the SASP components from the SenMayo61 dataset revealed that L2AKD cells have constitutively elevated secretion of some SASP factors and reduced secretion of others, including HMGB1, MIF and several SERPINEs, upon induction of senescence (Extended Data Fig. 5m). Overall, these findings support that CMA-deficient cells have a deregulated basal secretome and impaired secretory adaptation to senescence.
We completed the characterization of the secretome of CMA-deficient cells by comparing extracellularly released metabolites, as they also contribute to SASP57. We found that CMA deficiency markedly alters the extracellular metabolome, with many changes overlapping those observed in aged cells (Extended Data Fig. 6a−f and Supplementary Note 3). These metabolites are enriched in regulators of immune and macrophage function, with a strong bias toward proinflammatory signaling, and senescence further amplifies these abnormalities (Extended Data Fig. 6g and Supplementary Note 3).
To assess the functional impact of these secretome changes, we analyzed their prosenescent activity, as the SASP induces paracrine senescence in neighboring cells62,63. We exposed control fibroblasts for 5 days to conditioned medium from control and CMA-deficient fibroblasts, either induced or not into senescence (Fig. 3h). As expected, medium from senescent Ctrl and L2AKD cells increased the number of SA-β-gal+ cells, p21 protein levels and nuclear localization, and decreased nuclear HMGB1 levels (Fig. 3i–l). Notably, the basal secretome of L2AKD cells elicited similar changes (Fig. 3i–l). Additional markers (p53, HMGB1, CD47 protein and p16INK4A, Tnf and Il1α mRNA) confirmed that the CMA-deficient secretome induces paracrine senescence, although notably, some of these effects were partially reduced in the secretome from senescent L2AKD cells (Extended Data Fig. 6h,i).
These findings support that failure of CMA to timely degrade proteins involved in protein synthesis, trafficking and secretion, drives changes in the cellular secretome, thereby enhancing its prosenescent paracrine effect on fully functional neighboring cells.
Impact of the secretome of CMA-deficient cells on the immune response to senescence
As the SASP acts as a distress signal that recruits immune cells for senescent cell clearance, we next examined how CMA-dependent secretome changes impact the immune system. Given the enrichment of the L2AKD cell secretome in immunomodulatory proteins and metabolites known to affect macrophage responsiveness (Extended Data Figs. 5l and 6g), we examined how CMA-deficient senescent cells interact with the immune system, focusing on macrophages and their relevance during aging. We first compared CMA activity in bone marrow-derived macrophages (BMDMs) from young and aged KFERQDendra mice and found a significant reduction of CMA in BMDM from aged mice of both sexes (Fig. 4a). Of note, the secretome of senescent fibroblasts reduced CMA activity in young macrophages, with a stronger inhibitory effect from the secretome of L2AKO fibroblasts, even before senescence induction (Fig. 4b), suggesting that senescent cells may exacerbate the age-dependent decline in macrophage CMA.

a, Representative immunofluorescence images for Dendra in BMDMs from 4 m- and 23 m-old female and male KFERQ-Dendra2 mice (top). Nuclei are highlighted with DAPI. Insert shows higher magnification of the boxed area. Quantification of the number of Dendra+ puncta per macrophage (Φ) (bottom). n (left to right) = 6, 7, 7, 8 mice. b, Representative immunofluorescence images for Dendra in BMDMs supplemented with medium from fibroblasts Ctrl or L2AKO (F), induced or not into senescence (P-F) (top). Nuclei are highlighted with DAPI. Quantification of Dendra+ puncta per macrophage (bottom). n = 36, 23, 39, 60, 40 cells from three independent experiments. c, Representative immunofluorescence images for F4/80 and vimentin of BMDM isolated from Ctrl mice and mice with L2A deletion in macrophages (ML2A−/−) co-cultured for 48 h with Ctrl and L2AKO fibroblasts untreated (none) or 7 days after addition of Palbo (P-F) (top). Nuclei are highlighted with DAPI. Quantification of number of fibroblasts (left) and of macrophages (right) present in the culture at the end of the experiment (bottom). n = 3, 4, 4, 3 independent experiments. d, Representative immunofluorescence images (left) and quantification (right) of Ctrl and ML2A−/− macrophages incubated with IgG-conjugated beads. n = 6, 5 independent experiments. e, Representative flow cytometry plots (left) and quantification (right) of percent of efferocytosis in Ctrl and ML2A−/− macrophages co-cultured for 48 h with Ctrl fibroblasts untreated (none) or 7 days after addition of Palbo (P-F) and subjected to staurosporine-induced cell death. n = 3 independent experiments. f,g, Representative immunofluorescence images for F4/80 and FITC IgG beads (left) and quantification of FITC IgG fluorescence (right) in Ctrl macrophages supplemented for 48 h with the secretome of Ctrl and L2AKO fibroblasts induced into senescence with Palbo (f) or Etopo (g). n = 13, 7 (f) and 13, 13 (g) fields from three independent experiments. h, Representative immunofluorescence images for F4/80 and FITC IgG beads (left) and quantification of FITC IgG fluorescence (right) in Ctrl macrophages supplemented for 48 h with the secretome of Ctrl and L2AKO fibroblasts induced into senescence with Palbo. Macrophages were supplemented with vehicle (CA−) or treated with the CMA activator (CA+) and incubated with FITC IgG beads. n = 10, 11, 10, 11 fields from three independent experiments. i, Representative immunoblot for SIRPα (left) and quantification (right) of Ctrl and ML2A−/− macrophages incubated in absence (−) or presence (+) of ammonium chloride and leupeptin (N/L) for 24 h. n = 5 independent experiments. j, Representative immunoblot for SIRPα (left) and quantification (right) of Ctrl and ML2A−/− macrophages incubated or not with N/L and Dynasore (dyn). n = 11, 11, 6, 5 independent experiments. k, Representative immunoblot for SHP-1 (left) and quantification (right) of Ctrl and ML2A−/− macrophages. n = 3 mice. l, Graphical scheme of SHP-1, SIRPα and CD47 interaction as part of the ‘do not eat me’ signal axis. Scheme created in BioRender; Sereda, R. (2026) Ponceau staining is shown in i−k as loading control. Data represent mean ± s.e.m. and individual values. Unpaired two-sided t-test (a,d,f,g,i,k) and two-way ANOVA test (b,c,e,h,j) were used. All values were compared but only P values of statistically significant comparisons are shown.
Source data
Source data
Source data
To explore the functional consequences of this reduced macrophage CMA on senescent cell immunoclearance, we isolated BMDM from a previously generated macrophage-specific CMA-deficient mouse line (LysMCre-L2A−/−; ML2A−/−)33, where we confirmed efficient L2A deletion (Extended Data Fig. 7a). Co-culture of senescent Ctrl or L2AKO fibroblasts with CMA-competent or -deficient macrophages revealed increased persistence of senescent cells in cultures with L2A−/− BMDMs, regardless of fibroblast CMA status (Fig. 4c). Notably, co-culture of L2A−/− BMDM with CMA-deficient senescent fibroblasts was cytotoxic, leading to substantial macrophage death within 48 h (Fig. 4c), despite similar viability between control and L2A−/− BMDM under basal conditions (Extended Data Fig. 7b). This cytotoxic effect was paracrine in nature, as conditioned medium from CMA-deficient fibroblasts induced into senescence using either Palbo or etoposide (Etopo), increased macrophage death, with the strongest toxicity observed in L2A−/− BMDM (Extended Data Fig. 7c,d).
We propose that the age-related decline of CMA in macrophages and their exposure in aged organisms to the secretome from CMA-deficient senescent cells impair macrophage function and viability, potentially compromising the immune clearance of senescent cells in aging tissues.
Loss of CMA in macrophages compromises phagocytosis
To determine whether reduced senescent fibroblast clearance by L2A−/− BMDM resulted solely from increased macrophage death or if intrinsic functional defects also contributed, we further characterized these macrophages. L2A deletion in BMDM did not impair macroautophagy flux (Extended Data Fig. 7e) but did decrease their phagocytic capacity (Fig. 4d) without affecting internalization of extracellular material through other processes such as micropinocytosis (Extended Data Fig. 7f). To determine if this phagocytic defect affected senescent cell clearance, we induced cell death in nonsenescent and senescent cells with staurosporine and found that efferocytosis of dead cells was significantly reduced in L2A−/− BMDM compared to Ctrl BMDM (Fig. 4e).
Of note, incubation of control macrophages with the secretome of cells induced into senescence with either Palbo (Fig. 4f) or Etopo (Fig. 4g) was sufficient to reduce their phagocytic activity, with a more pronounced inhibitory effect when the secretome was derived from senescent L2AKO fibroblasts. To determine whether this paracrine reduction in phagocytosis was in part due to impaired CMA in macrophages, we treated them with CA77.1 (CA), a small-molecule activator of CMA64, described in later sections. CMA upregulation did not fully restore phagocytosis but was sufficient to improve the compromised phagocytic activity of macrophages exposed to the CMA-deficient secretome (Fig. 4h).
L2A−/− BMDM displayed some senescence-like features including a trend toward increased SA-β-gal staining, a significant reduction in nuclear HMGB1, comparable expression of p16INK4A and significantly elevated p21 protein levels without transcriptional upregulation (Extended Data Fig. 7g–k). BMDM from aged mice displayed similarly elevated p21 levels (Extended Data Fig. 7l), suggesting a contribution of age-related CMA decline to these senescent-like features. The secretome from control or L2AKO senescent fibroblasts did not alter p21 levels in macrophages (Extended Data Fig. 7m), but L2AKO senescent media increased iNOS expression in both BMDM genotypes (Extended Data Fig. 7n), confirming its proinflammatory properties. Overall, our findings highlight that the CMA-deficient secretome primarily impairs macrophage phagocytosis and survival, rather than promoting their senescence.
To explore the basis for the phagocytic defect in L2A−/− macrophages, we searched for phagocytosis-related proteins differentially degraded in lysosomes isolated from control and L2AKO M0 and M1 macrophages32. Of the eight proteins with altered degradation (seven reduced and one increased) in M1, only reduced CMA degradation of signal regulatory protein α (SIRPα, an inhibitor of phagocytosis65) or increased degradation of IRGM1 (involved in phagosome maturation) would reduce phagocytosis (Extended Data Fig. 7o). We focused on SIRPα because of its more upstream involvement in phagocytosis and confirmed both its reduced lysosomal degradation and resulting higher levels in L2A−/− macrophages (Fig. 4i and Extended Data Fig. 7p), also observed in BMDM from aged mice (Extended Data Fig. 7q). As CMA blockage in other cells reduces endocytosis45,49, we blocked endocytic cargo internalization with Dynasore and this eliminated differences in SIRPα lysosomal degradation between control and L2A−/− BMDM, supporting that they originate from compromised SIRPα endocytosis (Fig. 4j). Elevated SIRPα levels in L2A−/− BMDM were associated with increased levels of src homology-2 (SH2)-domain-containing protein tyrosine phosphatase (SHP-1) (Fig. 4k and Extended Data Fig. 7r), which docks on SIRPα to suppress the actin cytoskeleton reorganization required for phagocytosis66 (Fig. 4l). Phalloidin staining demonstrated differences in levels and organization of the actin cytoskeleton in L2A−/− BMDM (Extended Data Fig. 7s). BMDM from aged female mice also displayed higher SHP-1 levels than young counterparts (Extended Data Fig. 7t).
These results indicate that CMA enables macrophage phagocytosis by terminating the CD47-SIRPα ‘do not eat me’ signaling, but the senescent secretome is sufficient to alter macrophage phagocytosis, polarization and survival.
In vivo CMA loss in macrophages increases senescent cell burden
To determine whether CMA dysfunction in macrophages also compromised senescent cell immune clearance in vivo, we used ML2A−/− mice with efficient macrophage LAMP2A deletion32 (Extended Data Fig. 7a). We analyzed engagement of the senescence program and senescent cell abundance using aging as a chronic stimulus of senescence or in response to an acute senescence-inducing challenge such as wound healing (Fig. 5a).

a, Schematic of the experimental analysis of senescence in mice control or with L2A deletion in macrophages (ML2A−/−) upon a chronic (aging) and acute (wound healing) senescence-inducing paradigm. Scheme created in BioRender; Sereda, R. (2026) b–i, Quantification of number of SA-βgal+ cells by flow cytometry (b–e) and intensity of nuclear HMGB1 by immunofluorescence (f–i) in gWAT (b,f), liver (c,g), lung (d,h) and midbrain (e,i) from male and female 23 m Ctrl and ML2A−/− mice. The DG region is shown in i. Data correspond to n (left to right) = 9, 6, 10, 11 mice (b); 10, 8, 10, 13 mice (c); 10, 8, 7, 11 mice (d); 2, 3, 3, 3 mice (e); 9, 9, 8, 9 mice (f); n = 42, 43, 118, 121 cells from four male and nine female mice, respectively (g); n = 96 cells from five mice per group (h); and n = 1,561, 2,209, 1,580, 1,580 cells from five male and four female mice per group (i). j, Heatmap of z-scores of expression of the indicated genes from the SenNet gene dataset in macrophage populations (Kupffer cells and monocyte-derived macrophages) obtained from analysis of single-cell RNA-seq of liver from 4 m Ctrl, 23 m Ctrl and 23 m ML2A−/− mice. n = 4 mice per group. k, Representative immunoblot for SHP-1 (left) and quantification (right) in liver from 4 m, 14 m- and 24 m-old Ctrl and ML2A−/− mice. n = 4, 3, 4, 6, 8 mice. l, Representative images (left) of TUNEL staining and quantification (right) of liver from male (left) and female (right) Ctrl and ML2A−/− mice. n = 5 mice per group. m, PCA of 16 variables measured in tissues from Ctrl and ML2A−/− mice. Each dot represents a mouse. Ellipses are the 95% CI around the center of mass of a given experimental group. n,o, Healing of wounds inflicted onto 12 m-old Ctrl and ML2A−/− mice. n, Representative images (left) and wound healing progression (as changes in wound size) (right). n = 8 (Ctrl), 7 (ML2A−/−) mice. o, Representative immunofluorescence images of the wound region for p21, F4/80 (left) and quantification of average intensity (Int.) of F4/80+ (middle) and p21+ (right) in cells. n = 6, 4, 6, 4 mice. Ponceau staining is shown in k as a loading control. Data represent mean ± s.e.m. and individual values. Unpaired two-sided t-test (b−i,l,o) and two-way ANOVA test (k,n) were used. All values were compared but only P values of statistically significant comparisons are shown.
Source data
Source data
Under the aging paradigm (23-month-old mice), we found that male ML2A−/− mice displayed significantly higher numbers of SA-β-gal+ cells in gonadal white adipose tissue (gWAT), liver and lung than their littermate controls (Fig. 5b–d). We observed a similar trend in the brain, largely attributable to the dentate gyrus (DG) of the hippocampus (Fig. 5e and Extended Data Fig. 8a). These differences were not as evident in females (Fig. 5b–e). Because SA-β-gal staining reflects expansion of the lysosomal compartment and given the reported sex-specific age-related changes in these organelles29, we investigated additional senescence markers in these animals and found a significant decrease in nuclear HMGB1 in gWAT, liver, lung and brain of both male and female ML2A−/− mice compared to controls, except in female lungs (Fig. 5f–i). Protein levels of p21 were elevated in the gWAT, liver and lungs of ML2A−/− mice, whereas p53 levels were elevated in the liver, lungs and cerebral cortex compared to control mice (Extended Data Fig. 8b).
Trichrome staining to assess organ fibrosis as a downstream effect of senescence burden, revealed minor upward trends in gWAT and liver in ML2A−/− mice (Extended Data Fig. 8c,d), but we found tissue-specific changes associated with senescence such as a decreased gWAT depot and adipocyte size in both male and female ML2A−/− mice (Extended Data Fig. 8e), and increased liver polyploidy (Extended Data Fig. 8f), known to augment with age67 and accelerate with senescence68,69.
In contrast to the reduced numbers of ML2A−/− macrophages when incubated with senescent medium in vitro, we found an increase in both gWAT and liver macrophages in ML2A−/− mice (Extended Data Fig. 8g,h). We analyzed the state of CMA-deficient macrophages in situ in the liver using single-cell RNA sequencing (RNA-seq) of livers from young and aged control and aged ML2A−/− mice (Supplementary Fig. 1a). The SenNet senescence transcriptional signature was higher in liver-resident macrophages (Kupffer cells) and monocyte-derived macrophages than in hepatocytes, consistent with their overlap with inflammatory programs (Supplementary Fig. 1b). This signature displayed marked age-related changes in both Kupffer cells and monocyte-derived macrophages that were further accentuated in ML2A−/− mice when compared to age-matched Ctrl mice (Fig. 5j and Supplementary Fig. 1c). The SenNet signature was also different in ML2A−/− hepatocytes compared to controls (Supplementary Fig. 1d), supporting our findings of increased senescent cell content in the livers of these mice. As most SenNet gene products are SASP components, it is possible that the increase in senescence features in the ML2A−/− mice organs is a consequence of the SASP of CMA-deficient macrophages acting on neighboring cells.
Consistent with the phagocytic defect of CMA-deficient macrophages in vitro, SHP-1 protein levels increased with age and were further elevated in ML2A−/− mice (Fig. 5k) along with an increase in CD47 levels in these mouse tissues (Extended Data Fig. 8i). In support of compromised phagocytic clearance abilities of macrophages in the ML2A−/− mouse tissues, we found an increased number of TUNEL+ cells in these mice, particularly pronounced in the liver (Fig. 5l and Extended Data Fig. 8j). As hepatic damage markers were unchanged (Extended Data Fig. 8k), we propose that the increase in TUNEL+ apoptotic bodies likely reflects their impaired phagocytic clearance. Despite some tissue- and sex-specific differences, PCA of the 16 markers analyzed clearly separated control and ML2A−/− mice (Fig. 5m), supporting a different ability to handle senescent cell burden.
Next, to study the immune clearance properties of CMA-deficient macrophages in vivo, independently of aging, we used an acute wound-healing paradigm in 12-month-old mice. Fifteen days after injury, ML2A−/− mice exhibited a significantly larger wound area (Fig. 5n) and delayed wound closure (Fig. 5n). Histological analysis revealed disorganized tissue architecture, with more diffuse wound edges and larger numbers of remaining p21+ cells, despite a higher abundance of macrophages in the injured region (Fig. 5o). Altogether, these findings support that impaired CMA in macrophages delays tissue repair and promotes local senescent cell buildup during wound healing.
Chemical activation of CMA in aging reduces senescent cell burden
To explore whether reactivation of CMA in aged mice could be effective in reducing their senescent cell burden, we utilized CA, a previously generated small-molecule activator of CMA64 (Fig. 6a and Supplementary Note 4). Oral administration of CA (30 mg kg−1 bodyweight) to 18-month-old mice for 5 months prevented the increase with age in the number of SA-β-gal+ cells in gWAT, liver and lung in both sexes (Fig. 6b–d) and the transcriptional upregulation of the senescence markers p21, Tnf, Il1α, and p16INK4A across tissues (Fig. 6e,f and Extended Data Fig. 9a–f). Masson’s trichrome staining revealed some reduction in liver fibrosis in CA-treated aged mice that was more noticeable in the gWAT of both sexes (Fig. 6g,h). PCA with all the markers and tissues confirmed that CA-treated aged mice remained closer to the young group in both males and females (Fig. 6i and Extended Data Fig. 9g, shows analysis per tissue).

a, Wild-type 18 m-old mice received daily gelatin pellets containing vehicle or CA and after 5 months, senescence markers were analyzed in multiple tissues and compared to those in young (6 m-old) mice. Scheme created in BioRender; Sereda, R. (2026) b,c, Quantification of percentage of SA-β-gal+ cells by flow cytometry in the indicated tissues from female n (left to right) = 14, 14, 14 (gWAT) and 15, 14, 14 (liver) mice (b) and male n = 16, 13, 12 (gWAT) and 9, 8, 8 (liver) mice (c). d, Representative SA-βgal images (left) and quantification (right) of lung sections from the same mice groups. n = 6, 7, 8 (female) and 8, 5, 5 (male) mice. e,f, Quantification of p21 mRNA levels in the indicated tissues from female n = 5, 4, 4 (gWAT) and 13, 7, 6 mice (liver) (e) and male n = 7, 6, 8 (gWAT) and 13, 7, 10 (liver) mice (f). g,h, Representative images (left) and quantification (right) of trichrome stained liver (g) and gWAT (h) from male and female mice. n = 8, 12, 16 (female liver), 16, 16, 15 (male liver), 16 per group (male and female gWAT) fields coming from four mice per group. i, PCA of five senescence-related variables measured in three tissues from male and female 6 m-old mice and 23 m-old mice after 5 months of daily administration of vehicle or CA. Discontinuous arrows indicate the directionality of the changes in the aged group upon administration of CA. j, Representative immunofluorescence images (top) and phagocytosis quantification (bottom) after incubation of BMDMs from the indicated mice groups with IgG-coated beads. n = 8, 8, 9 independent experiments. Data represent mean ± s.e.m. and individual values. NS, not significant. Box-and-whisker plots in b−h and j show the mean, interquartile range and min−max values. One-way ANOVA test was used. All values were compared but only P values of statistically significant differences relative to the young group are shown.
Source data
Although CA is administered systemically, part of its effect can be attributed to macrophages as we showed that a 48-h CA treatment of BMDM isolated from 23-month-old mice resulted in a notable recovery of their phagocytic activity, elevating it to levels comparable to those of BMDMs from 6-month-old mice (Fig. 6j).
Overall, our findings demonstrate that pharmacological upregulation of CMA in aged mice effectively reduces senescent cell burden and fibrosis in multiple organs, in part by restoring macrophage phagocytic capability.
Activation of CMA reduces senescence and prevents development of lung fibrosis
We next explored the effects of CMA stimulation on idiopathic pulmonary fibrosis (IPF)70, a prototypical senescence-associated disease. Using single-cell RNA-seq data from healthy human lungs (aged 18–98 years), we calculated a predictive CMA score based on the weighted expression and directionality of 20 genes in the transcriptional CMA network45. CMA score decreased with age in lung fibroblasts, alveolar type 1 (AT1) and alveolar type 2 (AT2) cells, in males but only in AT2 cells in females (Fig. 7a and Extended Data Fig. 10a). Similar analysis using pseudobulk RNA-seq data demonstrated a significant decline in the CMA score of patients with IPF (Extended Data Fig. 10b). Single-cell RNA-seq analysis confirmed a decreased CMA score in specific macrophage subtypes, including SPP1 macrophages, known to contribute to fibrosis-associated inflammatory processes71, as well as in AT1 cells in lungs from patients with IPF (Extended Data Fig. 10c). Furthermore, lysosomes isolated from these human lungs (Extended Data Fig. 10d), revealed markedly reduced L2 levels in individuals with IPF, which seemed to be due to instability of the CMA receptor, as inhibition of lysosomal proteolysis partially restored L2 levels (Fig. 7b). Consistent with their low L2 levels, lysosomes from IPF lungs showed reduced substrate uptake using a standard in vitro CMA assay (Extended Data Fig. 10e).

a, CMA transcriptional score calculated from the normalized RNA expression (z score) of the components of the CMA network in lung fibroblasts from healthy human males and females of the indicated ages. n = 6 (males), 4 (females) lung samples. b, Immunoblot for LAMP2 (L2) in lysosomes isolated from lungs of healthy controls (Ctrl) and patients with IPF upon incubation in absence (−) or presence (+) of protease inhibitors (PIs). Two different sets are shown. The same pattern was observed in three out of four sets of lungs analyzed. c, Representative immunofluorescence images for Dendra and LAMP1 (left) and quantification (right) of KFERQ-Dendra+ puncta in fibroblasts of lung sections from 4 m and 23 m-old KFERQ-Dendra female and male mice. Right shows boxed region at higher magnification. n (left to right) = 307, 204, 190, 118 cells from five mice per group. d–f, Representative immunofluorescence images for Dendra and LAMP1 (d) and quantification of CMA activity as number of Dendra+ LAMP1+ puncta per cell (e) and number of LAMP1+ puncta (f, left) and percentage of LAMP1+ puncta positive for Dendra (f, right) in fibroblasts in lung sections from KFERQ-Dendra mice 14 days after being infused with PBS or bleomycin (Bleo). n = 4 (PBS), 5 (Bleo) male mice. g–m, Bleo-injected male mice received daily gelatin pellets with vehicle or CA from day 2 (D2, early CA) or day 7 (D7, late CA) post-Bleo injection. Scheme created in BioRender; Sereda, R. (2026) (g). h, Body weight measurements post-Bleo injection. n = 5, 6, 7, 7 mice. i, Representative images (left) and quantification (right) of trichrome stained lung sections at day 15 post-Bleo injection. n = 5, 4, 7, 5 mice. j,k, Quantification of Col1α1 (j) and p16INK4A (k) mRNA levels in lungs at day 15 post-Bleo injection. n = 4, 5, 7, 5 mice. l, Representative images (left) and quantification (right) of immunohistochemistry staining for F4/80 in lungs from the indicated mouse groups. n = 5, 5, 7, 5 mice. m, Heatmap of z-scores of expression of senescence and inflammation genes in lungs collected at days 4, 7 and 14 post-Bleo injection. n = 5 mice per group. n,o, Immune cell analysis by flow cytometry in lungs collected at days 4, 7 and 14 post-Bleo injection (n). Time course of changes in abundance of specific immune populations (o). n = 5 mice per group. p, Representative images (left) and quantification (right) of lung sections stained for CD4. n = 4, 4, 4, 4, 4, 4, 4, 4, 4, 5 mice. Ponceau staining is shown in b as a loading control. Box-and-whisker plot shows the mean, interquartile range and min–max values. Data represent mean ± s.e.m. and individual values. Unpaired two-sided t-test (e,f), one-way ANOVA (i–l,p) and two-way ANOVA (c,h,m,o) test were used. All values were compared but only P values of statistically significant differences are shown except in i–l where comparisons with PBS are all marked independently of significance. Differences in m are relative to the same times with PBS.
Source data
Source data
Source data
To determine whether the age-dependent CMA decline in human lungs also occurs in mice, we analyzed CMA activity in lung fibroblasts from 4–6 m- and 23–28 m-old KFERQDendra2 mice. CMA activity was significantly higher in young female lung fibroblasts compared to young males and declined with age in both sexes (Fig. 7c). In addition to the decrease in transcriptional CMA score with age in both sexes, females displayed decreases in total lysosomal abundance and in the fraction of lysosomes competent for CMA, whereas in males CMA decline seemed to result primarily from a reduced proportion of CMA-competent lysosomes (Extended Data Fig. 10f–h).
We next investigated changes in CMA during lung fibrosis by administering bleomycin intratracheally72 to KFERQDendra2 mice. We found transcriptional downregulation of many CMA components, with an overall reduction in the transcriptional CMA score (Extended Data Fig. 10i); however, CMA activity (measured as Dendra-positive puncta) in fibroblasts from bleomycin-treated mice was preserved (Fig. 7d–f). Given the higher frequency of IPF in males, and their lower basal CMA activity in both humans and mice, we tested whether pharmacological CMA upregulation in this sex would protect against lung fibrosis. We initiated daily oral administration of CA, 2 days (early CA) or 7 days (late CA) after bleomycin instillation in 4 m-old male mice and collected the lungs on day 15 (Fig. 7g). Early CA administration prevented the bleomycin-induced decrease in the transcriptional CMA score, but not when CA treatment began after day 7 post-bleomycin infusion (Extended Data Fig. 10i). Early CMA activation provided notable preservation of body weight, an indirect readout of disease progression/severity, whereas later treatment only showed a slight trend toward body weight gain from day 11 (Fig. 7h). The early CA group also displayed reduced lung fibrosis (Fig. 7i), overall lower levels of fibrosis, senescence and inflammation markers such as Collagen1α1 and p16INK4A (Fig. 7j,k), and reduced frequency of lung-infiltrating F4/80+ macrophages (Fig. 7l).
To identify the early effects of CMA activation behind the observed protection, we used the same experimental design but collected lungs on days 4, 7 and 14. We found comparable initial collagen deposition in CA-treated and untreated mice by day 4, but by day 7, early CA treatment reduced lung fibrosis (55.35 ± 1.39% reduction), whereas late CA administration had a more modest effect (23.83 ± 0.12% reduction) (Extended Data Fig. 10j). By day 14, early CA treatment reduced senescence- and inflammation-related gene expression (Vcam1, Mmp10, Mmp12, p16INK4A, p21, p53 and Tnf) although some genes (p21, p53, collagens and IL genes) displayed an initial upregulation at day 7, followed by a decrease by day 14 (Fig. 7m).
Given that the higher efficacy of CA treatment coincided with the inflammatory phase, we performed lung immune profiling by flow cytometry at different times (Fig. 7n and Extended Data Fig. 10k). This analysis revealed early increases in lung macrophages/monocytes in both CA- and vehicle-treated bleomycin-challenged mice; however, while the expansion of these compartments persisted late into the disease in the vehicle group, lungs from early CA-treated mice showed a gradual normalization in macrophage numbers (Fig. 7n). Numbers of lung T cells and neutrophils increased by day 7 and remained elevated throughout (Fig. 7n). Lung immunohistochemistry revealed an early (D4) increase in lung regulatory T cells, followed by predominantly CD4+ T cell expansion at later times (Fig. 7o,p and Extended Data Fig. 10l,m). These results suggest that CMA activation sustains immune responses that favor fibrosis resolution. Notably, late CA treatment increased lung macrophages/monocytes (Fig. 7n and Extended Data Fig. 10n), highlighting macrophages as key CMA targets that may facilitate senescent fibroblast clearance and limit lung fibrosis progression.
Overall, our data highlight the importance of early CMA activation in IPF and how proper CMA function can ameliorate IPF severity by reducing lung fibrosis and orchestrating the elimination of senescent cells.