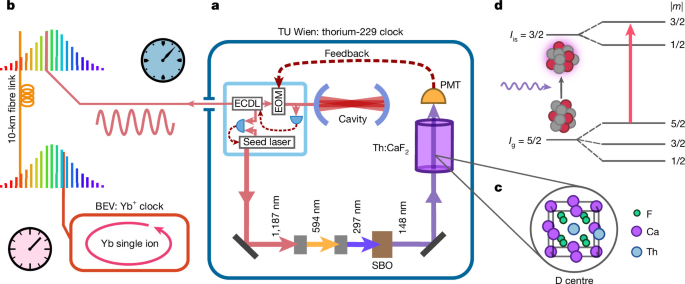
Laser set-up
In the 229Th interrogation system, a commercial laser (FHG-TA Pro, TOPTICA) provides an output power of approximately 500 mW at a wavelength of 296.8 nm, frequency-quadrupled in two doubling stages and one amplification stage from a diode seed laser at 1,187 nm. The final second-harmonic-generation process is based on nonlinear frequency conversion in an SBO crystal kept under a high-purity N2 atmosphere (purity 5.0). Fundamental radiation still present in the beam after the final second-harmonic-generation step is separated using three dielectric-coated mirrors. For the absorption measurements, we used a head-on type PMT (R6835, Hamamatsu) mounted inside the vacuum chamber and operated at 2.5 kV. We used the same segment of the X2 sample60 as in ref. 7. The segment in use has a cylindrical geometry with a diameter of 3.1(1) mm and a length of 4.2(1) mm and was oriented such that the beam traversed along the centre line of the piece. The measured average concentration of 229Th in the segment was 6.6(5) × 1015 mm−3.
The seed laser of the FHG-TA was locked to the clock laser (CLS, TOPTICA) through an offset frequency phase lock. A fast photodiode with a bandwidth of 10 GHz measured the beat frequency between the two lasers, which was then mixed with a reference frequency. The fast loop of this lock actuated on the seed laser diode current, and the slow loop was used to steer the grating of the laser diode. The laser was scanned by modulating the reference frequency.
Like the actuators of the offset lock, the Pound–Drever–Hall lock of the clock laser to the cavity was also configured such that the fast feedback loop actuated on the laser diode current, whereas the slow feedback signal of the Pound–Drever–Hall scheme controlled the position of the grating for optical feedback to the laser diode.
For clock comparison measurements and drift rate measurements of the cavity, the beat frequency fb of the clock laser with the frequency comb (FC1500-250-ULN, Menlo) was recorded using a dead-time-free frequency counter (K+K FXE) operated in Π-type counting mode61,62 at a gate time of 1 s. Our method of comparing the thorium clock at TU Wien with the Yb+ clock (TOPTICLOCK, TOPTICA)63 at BEV follows the scheme described in ref. 7. The Yb+ clock was based on the 435.5-nm E2 transition of a single 171Yb ion.
All frequency synthesizers and counters in the 229Th clock system and the frequency comb were referenced to the 10-MHz signal of a commercial Rb clock (FS725, SRS).
To perform an absorption measurement at a specific frequency, we modulated (square wave) the offset lock frequency between the seed laser diode and the clock laser with 10 Hz between the target frequency and an off-resonance frequency. Each modulation cycle was also reflected in a synchronization signal connected to a time-resolved pulse counter (TimeTagger Ultra, Swabian Instruments). The modulation ensured that power fluctuations in the laser output did not affect the measurement. The detection set-up consists of a PMT, a radiofrequency amplifier and the pulse counter, which binned the arriving pulses from the PMT relative to the last synchronization edge. The absorption was then calculated by subtracting the on-resonance counts from the off-resonance counts and dividing by the off-resonance counts.
Clock operation
To operate the set-up as a clock, we first acquired a single absorption spectrum, as shown in Extended Data Fig. 2a. We observed that a Lorentzian line shape fits our absorption measurement data well. We then measured the expected error signal (Extended Data Fig. 2b). To measure an error signal, we modulated the offset lock frequency with 10 Hz between two frequencies flow and fhigh. The difference Δf = fhigh − flow was kept constant during the measurement, and only the centre was swept across the resonance. In our measurements, we used a frequency deviation Δf of \({f}_{{\rm{FWHM}}}/\sqrt{3}\), with fFWHM describing the FWHM of the measured absorption peak (Extended Data Fig. 2a). We fitted this signal with the function
$${y}_{{\rm{f}}{\rm{i}}{\rm{t}}}(f)=\frac{{A}_{{\rm{L}}}}{1+{\left(\frac{f+\Delta f/2}{\gamma }\right)}^{2}}-\frac{{A}_{{\rm{L}}}}{1+{\left(\frac{f-\Delta f/2}{\gamma }\right)}^{2}},$$
where AL is the amplitude and γ is the half width at half maximum of the Lorentzian. For the clock operation, the laser frequency was again switched between two frequencies while we adjusted the centre position with the feedback. For both frequency positions, the counts clow,i and chigh,i were recorded, where i is the measurement index for averaging the signal. The applied error signal E can be calculated as
$$E(c)={y}_{{\rm{fit}}}^{-1}\left(\frac{1}{L}\mathop{\sum }\limits_{i=1}^{L}\frac{{c}_{{\rm{high}},i}-{c}_{{\rm{low}},i}}{({c}_{{\rm{high}},i}+{c}_{{\rm{low}},i})/2}\right),$$
with the number of cycles L and the inverse fit function \({y}_{{\rm{fit}}}^{-1}(c)\). Extended Data Fig. 2c illustrates an adjustment step inferred by the calculation of E. With the integration times set in the clock operation, the beat was shifted after every interrogation cycle by the calculated value E, as shown in Extended Data Fig. 1.
Variation of the fundamental constants
The variation of α(t) relates to the variation of the ratio of the 229Th and ytterbium clock frequencies through: \(({k}_{\mathrm{Th}}^{\alpha }-{k}_{\mathrm{Yb}}^{\alpha })\times {\partial }_{t}\,\log \,\alpha
Source link
Related Posts

限制访问 – Le Monde
您可以获取授权,abonné au Monde, ou si vous souheit 来访问授权 d’accès à ce contenu,感谢联系人: 许可[@]法国集团 在页面副本上,包含 IP 地址和标识符 (RID)。 英文版 您的流量已被识别为自动化(机器人活动)。 如果您是《世界报》的授权合作伙伴、订户,或者如果您想请求访问此内容的权限,请联系:…

国联:面对比利时,齐达内要求蓝军“政变”
之后,意大利、法国将不再面对比利时的错误权利。三位得分手分别是齐达内的枪手和国际联盟的索梅茨。 10 月 5 日星期一,法国队与意大利队或法国队的三场比赛(1-1)对阵比利时队,对阵国际比赛。 澳元里拉国际联盟:意大利队在齐达内首场比赛中保持优势 目标:翻阅齐内丁·齐达内与法国队的第一场比赛的结果,得出结论。一场胜利也能让齐达内的球队在四分之一决赛中做出认真的选择。 “在政变中” Malgré l’état de gâce va l’indulgence 不会对三色旗运动图标有任何好处,在连续的 ferait tache 和 ternirait 任务中首次亮相(01s-0))。…
IDCF云攻击,495家企业和自治机构受到影响“恢复困难”
民众 2026.10.07.22.09 作者 梅林日奈子 [ITmedia] 起因是IDC IDCF,影响范围为495家公司和自治公司。 IDCF云中,系统收到第三方未经授权的访问,福岛県白河市数据中心“东日本里1”7日收到第三方未经授权的访问后出现故障。 IDC 日本新闻 在格林威治(东京都渮谷区),针对EC企业主的服务也受到同样的服务故障影响,库存管理工具“らくるからます”和“らくるか最安安しいすすするさこますするさんさんをさんさんをさんさんをさんですします」。 据报道,提供安全产品等的 fubaburain (东京都千代田区) 无法访问 PC 操作日志管理服务和安全产品管理屏幕。 除此之外,CMS工具还存在“Namudu云版”的问题,日本一区的服务器无法访问公共网站。 IT业种ますますますます相次ぐぐ 此外,日本篮球协会(JBA)、关西广播电台、胶囊旅馆「安寿司お宿」、卡拉OK连锁店「卡拉OK公园」也宣布网站及相关系统瘫痪7天。…