Spectroscopic observations
HS 0209+0832 was observed using HST/STIS in the FUV on 10 January 19994. Two exposures of 2,110 s and 1,140 s were taken using the MAMA detector and the E140M grating, covering the wavelength range 1,150−1,710 Å with a resolving power of R ≈ 45,800. We used the Hubble Advanced Spectral Products (HASP) spectrum, which combined the individual echelle orders into a single spectrum and co-added the two exposures. The resulting spectrum contains over 200 metal absorption lines, a deep Lyman-alpha line at 1,215 Å, and a He II line at 1,640 Å. There are gaps in the spectrum at 1,416−1,419 Å and 1,438.5−1,442 Å because these data are flagged as unreliable, which was caused by a large blemish from a shadow on the flat field correction from the repeller wire. The only absorption features present in this region are from metals that have many other lines in the spectrum, and hence, these gaps do not affect our results.
In addition, two short exposures were taken with the G230LB (600 s) and G430L (320 s) gratings, covering the wavelengths 1,685−3,065 Å and 2,900−5,700 Å with resolving powers of R ≈ 700 and R ≈ 500. The low resolution of these gratings prevents the detection of metal lines, but we used these data for measuring the white dwarf parameters.
Further FUV spectroscopy of HS 0209+0832 was taken with FUSE on 11 December 2002. The LWRS aperture was used covering a wavelength range of 925−1,180 Å with an exposure time of 4,986 s. The spectra across the four channels were combined, with a resolving power of R ≈ 20,000. The FUSE spectrum contains dozen of metal lines, several hydrogen lines and two helium lines.
Finally, HS 0209+0832 was observed with the UVES mounted on the VLT46 on 12–15 July 2000. Three 900-s exposures were obtained covering the wavelength range 3,300−6,690 Å at an average resolving power of R ≈ 19,155. There are no data in the region 4,560−4,580 Å owing to a gap between the detectors. No metal lines are detected in the UVES spectrum, which is unsurprising given the modest quality of that data, and as the transitions of highly ionised metals are much weaker in the optical compared with the FUV. However, we used the hydrogen and helium lines to constrain the white dwarf parameters.
White dwarf parameters
We computed a finely spaced white dwarf model atmosphere grid7 spanning effective temperatures of 30,000 ≤ Teff ≤ 40,000 K, surface gravities of 7.50 ≤ log g ≤ 8.50, and a fixed helium abundance of log(He/H) = −2.00. An initial fit to the Pan-STARRS photometry and Gaia parallax (Extended Data Table 1) resulted in a strong dependence on the assumed reddening, with Teff = 36,329 ± 970 K and log g = 7.918 ± 0.024 for zero reddening and Teff = 43,075 ± 1,827 K and log g = 8.049 ± 0.030 for E(B − V) = 0.01. Whereas the extinction towards HS 0209+0832 is low47 (E(B − V) < 0.01), this fit is subject to inherent uncertainties as the photometry only samples the Rayleigh–Jeans tail of the white dwarf spectrum. We also note that the uncertainties of the Pan-STARRS are unrealistically small, resulting in statistically poor fits.
We therefore adopted a hybrid approach, measuring the effective temperature by fitting the Balmer lines in the VLT/UVES and G430L HST/STIS spectra, and measuring the surface gravity from the photometry and parallax. The influence of reddening in this hybrid method is negligible. Taking the weighted mean of the analysis of the three UVES spectra and one G430L STIS spectrum, with zero reddening, results in Teff = 35,845 ± 535 K and log g = 7.904 ± 0.015. The fit to the ultraviolet spectra with these parameters is excellent (Extended Data Fig. 1), suggesting that they are well calibrated and that reddening is indeed negligible.
We measured a helium abundance of log(He/H) = −1.90 ± 0.20 from the He I (4,026 Å, 4,473 Å, 4,714 Å, 4,923 Å, 5,016 Å and 5,877 Å) and He II (4,686 Å) lines in the UVES spectra and the He II (1,640 Å) line in the E140M STIS spectrum. The uncertainty in log(He/H) determined from individual lines is 0.2 dex, which limits an assessment of the variability in the He abundance detected in the UVES and STIS spectra.
Photospheric abundances
With Teff, log g and log(He/H) fixed to the values determined above (Extended Data Table 1), we generated grids of synthetic spectra for Z = C, Al, Si, Ca, Ti, Ni, Cu, Zn and Nb with abundances in the range −10 < log(Z/H) < −4 in steps of 0.25 dex. Unless otherwise stated, the models use atomic data from the Vienna Atomic Line Database48,49,50,51. Interpolating across these model grids, we fitted the spectral regions of the HST/STIS and FUSE spectra, which contain absorption lines of a given element using a χ2 minimization technique (see Extended Data Table 2 for the detected absorption features). We detect multiple interstellar medium (ISM) lines (Extended Data Table 4) in the spectra, but the radial velocity of these lines differ from the photospheric line velocity, so the former are clearly resolved and can be masked during the fitting procedure. After estimating the abundances for each element in this way, we then computed new model grids allowing one element to vary, and fixing all other elements at the value from the initial analysis, and fitted the HST/STIS and FUSE data again. This process was repeated until all abundances converged. We report the abundances determined as the weighted mean of the individual fits to each line (or group of lines), and the standard deviation as the uncertainty.
To determine upper limits52 for N, O, P, S, Cl, V, Cr, Mn, Fe, Co and Sr, we selected a region that contained a strong line in the model but is undetected in the observed spectrum. We vary the metal abundance by 0.01 dex, determining the χ2 each time. The χ2 values are then converted to a likelihood using Jeffrey’s prior, and then the cumulative distribution function is computed. We set the upper limit to be the 99% confidence interval.
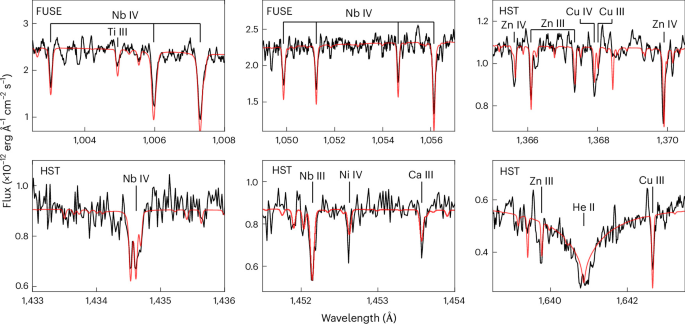
HS 0209+0832 was the first white dwarf with a detection of photospheric zinc4. We identified 42 Zn III and 40 Zn IV lines in the STIS spectrum, and used updated atomic data53 in our analysis. The zinc abundances determined from the different ionization states agree (log(Zn/H) = −6.24 ± 0.21), but we find the overall abundance to be higher than previously determined4 by ~0.9 dex. We attribute this difference to improvements in model atmospheres and atomic data.
Whereas several Cu IV lines were identified previously4 discrepant atomic data prevented an unambiguous measurement of the copper abundance. Using the updated atomic data54, we find a copper abundance of log(Cu/H) = −6.46 ± 0.14 that provides a good fit to all detected lines, and hence a firm detection of photospheric copper.
The niobium lines were identified using the National Institute of Standards and Technology (NIST) atomic line database55,56,57. All sufficiently strong lines predicted by the synthetic spectra match closely to those in the observed spectrum. We observe no discrepancy between the Nb III and Nb IV lines. The niobium abundance in the HST/STIS and FUSE spectra agree within errors.
We note that fitting the C IV resonance doublet (1,548 and 1,550 Å) results in log(C/H) = −4.81 ± 0.06, that is ~1.2 dex larger than log(C/H) = −6.04 ± 0.17 determined from the C II and C III lines (Extended Data Fig. 2). The overlap in wavelength between the HST/STIS and FUSE spectra allows independent measurements using the C III 1175 Å multiplet. The abundances determined from the two spectra taken ~4 years apart agree within the uncertainties. This situation is reminiscent of GD 394, a similarly warm (Teff = 35,700 K) white dwarf, in which high ionization lines of carbon, nitrogen and phosphorus were detected that were too strong compared with the photospheric abundances measured using low ionization states58. Given that the high-ionization lines in GD 394 have the same velocity as the lower ionization photospheric transitions, their origin is most likely a layer of hot gas just above the white dwarf photosphere58. In HS 0209+0832, the C IV lines also have radial velocities that match the C II and C III lines, so we argue that the C IV lines must originate in gas very close to the photosphere as well. Such a hot ‘chromosphere’ is to be expected as the white dwarf is accreting planetary material with relatively low local mass flow rates59, and has been detected in soft X-rays in the debris-enriched white dwarf G 29-38 (ref. 60).
We find a similar discrepancy in the titanium abundances using the Ti IV (log(Ti/H) = −5.79 ± 0.12, using the Kurucz line lists61) and Ti III (log(Ti/H) = −6.34 ± 0.23, using the VALD atomic data) lines. We detect a single Ti III line in the FUSE spectrum, which agrees with the abundance measured using the HST/STIS spectrum. Just as for carbon, the velocities for both ionization states agree; thus, we suggest hot gas close to the white dwarf surface as the cause for the higher abundance determined from the higher ionization lines.
Radiative levitation
At the effective temperature of HS 0209+0832, radiative levitation may provide support against gravitational settling for specific elements2,62,63,64,65. According to previous work, among the elements we detect in the photosphere of HS 0209+0832, C, Si and Al are probably susceptible to radiative support65, whereas Ca and Ni are not63,65. The radiative support of Ti, Cu, Zn and Nb in hot white dwarfs has not been assessed so far.
We quantitatively estimated the support provided for each of the detected elements (C, Al, Si, Ti, Ca, Cu, Zn and Nb), and a number of elements with upper limits that are of specific interest (N, P, S and Fe). We used our atmosphere code7 and followed a documented procedure11 to compute atmosphere structures and synthetic spectra that include both the effects of atomic diffusion and radiative levitation. In this process, we kept Teff and log g fixed to the values in Extended Data Table 1. In a first step, we computed the equilibrium abundances for each of the above elements, that is assuming no external accretion, depositing a small amount of the element within the atmosphere, and iterating the atmosphere structure until the gravity (downwards) and radiative levitation (upwards) result in a zero velocity of the element under consideration. We found that radiative support is entirely negligible for S, Ca, Ti, Fe, Ni, Cu, Zn and Nb. The remaining elements are radiatively supported at equilibrium abundances of log(C/H) ≃ −6.1, log(N/H) ≈ −6.5, log(Al/H) ≈ −7.2, log(Si/H) ≈ −6.5 and log(P/H) ≈ −6.3. In a final step, we computed the downward diffusion fluxes for the detected elements that are not affected by radiative levitation (Ca, Ti, Ni, Cu, Zn and Nb; Extended Data Table 3). Because sinking timescales are so short (~days), we assume that accretion is in the steady-state phase, that is, the downward diffusion flux is equal to the accretion rate.
The primary conclusion of this analysis is that the material accreted by HS 0209+0832 is genuinely rich in s-process elements. Another abundance anomaly to note is the very low Ni/Fe ≳ 2 (by number), compared with ~0.02 in the Sun, CI chondrites and bulk Earth14,15.
In the case of low accretion rates, it is expected that the photospheric abundances increase with time, saturating at or near the equilibrium value11,64,65. At higher rates, the effect of radiative support becomes increasingly negligible and the photospheric abundances will reflect the steady-state downward mass flux. We note that, for C and Al the photospheric abundances, log(C/H) = −6.04 and log(Al/H) = −7.37, are close to the levels predicted by radiative levitation, −6.1 and −7.2, respectively. However, we find a photospheric log(Si/H) = −8.26, which is much lower than the radiative equilibrium support of −6.5. A key assumption in the models of radiative levitation is that the atmosphere is entirely radiative, that is, devoid of bulk motion and the associated velocity fields. However, accretion inherently introduces a downward flux of material, and its effect on the atmosphere is currently not well understood. Some models predict large-scale convection due to thermohaline mixing34,66, and whereas the physical validity of these models is not fully established67, it is entirely possible that a sufficiently large inflow of material interferes—and possibly weakens or fully suppresses—radiative levitation. In the absence of a full understanding of these complex processes, we proceed with the most conservative assumption, that is, adopting the radiative support resulting from our atmosphere models as outlined above.
With the above caveat in mind, we note that radiative support predicts log(N/H) = −6.5, compared with the upper limit on the photospheric abundance of log(N/H) < −8.36. Compared with solar abundances, log(C/N) = 0.6, and given that both elements have similarly strong support by radiative levitation, these numbers may suggest that the abundance of carbon is enhanced in the material accreted by HS 0209+0832. At this effective temperature, helium is not radiatively supported and sinks from the atmosphere on timescales of months2,3. In fact, HS 0209+0832 is in the DB gap, a dearth of white dwarfs with atmospheric helium in the range 30,000 < Teff < 45,000 K (ref. 68). We therefore attribute the presence of helium to active accretion.
Our final conclusion is that HS 0209+0832 accretes material from an external source at a high rate of Macc,tot = 4.3 × 10⁸ g s−1 with a composition radically different to anything within the Solar System.
Photometric period
HS 0209+0832 (TIC 337075714) was observed with TESS in sectors 42, 43, 70 and 71 (20 August 2021 to 12 October 2021 and 20 September 2023 to 11 November 2023). For each sector, we retrieved the 2-min cadence TESS photometry, processed by the Science Processing Operations Center (SPOC)69, from the Mikulski Archive for Space Telescopes (MAST) using the lightkurve package70.
We combined the Pre-search Data Conditioning Simple Aperture Photometry (PDCSAP)71 from the four TESS sectors into a single light curve, removed all data that had a quality flag >0, and applied a >5σ clipping with respect to the median flux. We identified a significant signal with a false alarm probability (FAP) of ~4.4 × 10⁻¹⁶ at a period of 4.399 ± 0.026 days with an amplitude of 0.120% ± 0.018% within the Lomb–Scargle periodogram computed from the combined light curve (Fig. 4 and Extended Data Fig. 5).
To estimate the uncertainty in the period P, we evaluated the χ2 statistic on a fine grid of trial periods, minimizing at each grid point over the remaining free parameters (amplitude A, phase ϕ and baseline flux \(\bar{F}\)) by fitting the model \(F
Source link
Related Posts

康斯坦斯·齐默令人震惊的个人新闻:“大秘密”
康斯坦斯·齐默 (Constance Zimmer) 公开讲述了她今年早些时候与乳腺癌的秘密斗争。 “十月是#breastcancerawarenessmonth,我从没想过我会用我的故事来纪念它,”周日,这位女演员在 Instagram 上发表了一篇情感丰富的帖子。 “3 月 13 日,当我出门在外时,我通过 Zoom 听到医生说:‘你患有 DCIS,也称为 0 期乳腺癌,’”她回忆道。 “沉默震耳欲聋。” 沉迷于名人新闻?下载我们的新应用程序,不错过任何头条新闻 在 大约…

杰隆·丹尼尔斯:“梦想成真”今天为海盗队首发四分卫
在堪萨斯大学六年的大学生涯中,贾隆·丹尼尔斯从来不确定自己是否能进入 NFL。他当然不被认为是新秀时期有可能成为 NFL 首发四分卫的人选。 但这正是丹尼尔斯今天的样子:海盗队对阵包装工队的首发四分卫。贝克·梅菲尔德(Baker Mayfield)出局,新秀丹尼尔斯(Daniels)是下一个上场的人。他说他已经准备好了。 “我什至不知道是否可以用语言来表达,”丹尼尔斯说。 “这是梦想成真。能够在 NFL 组织中打球也是梦想成真。能够走出去并在 NFL 首发,这意味着一切。” 与近端锋的情况一样,丹尼尔斯很少进行进攻练习,直到上周梅菲尔德受伤为止。但他说他已经像开始时一样做好了准备。 “每周我都会做好准备,就好像我要参加首发代表一样,”丹尼尔斯说。 0-3 海盗队需要一场胜利。如果丹尼尔斯成功,这将成为本赛季 NFL 最令人惊讶的故事之一。 Source link

KI:“《世界报》覆盖了它的开头,讲述了一段路过的喧嚣”,Sagt Sam Altman – WELT
OpenAI 首席执行官 Sam Altmann 由 Risiken Künstlicher Intelligenz 领导,Gesellschaft 隶属 Risiken Künstlicher Intelligenz,隶属于 Technologie Weil der Nutzen。 Vom Rivalen Anthropic…